Black Population in US

Black Population Statistics

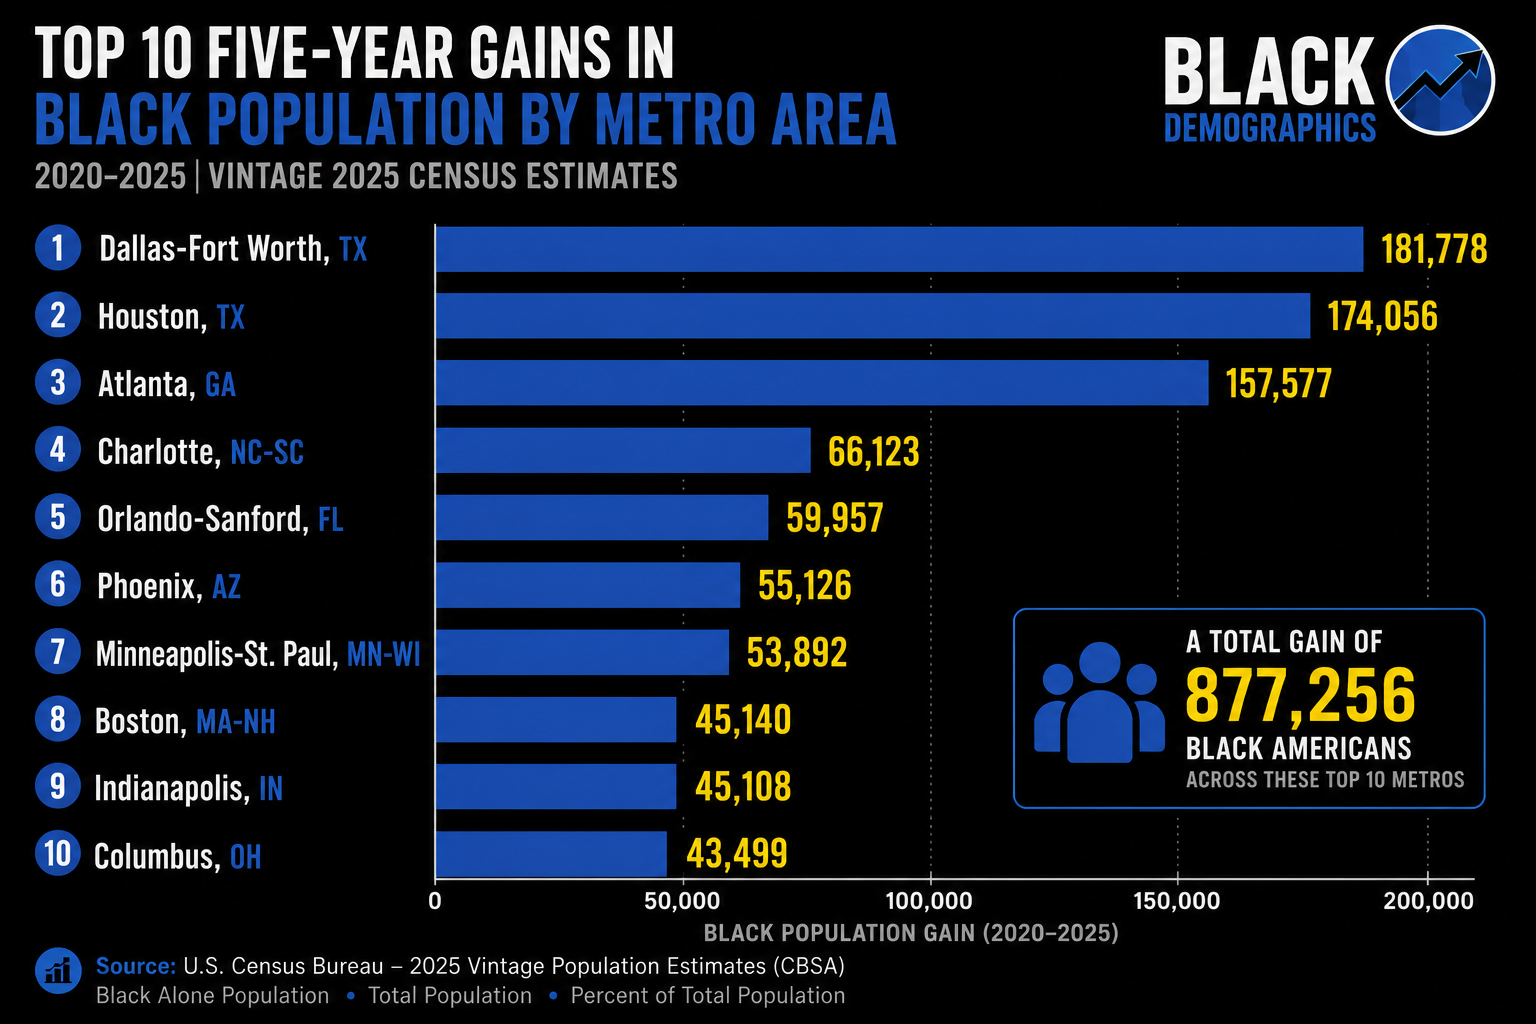
African American Population Growth
Between the years 1500 and 1820 more than 12.5 million African men, women, and children were loaded onto slave ships heading to the Americas. Approximately 2.5 million died along the way.
Fewer than 500,000 were brought to North America/United States (probably 410,000 and another 40,000 African born captives from the Caribbean) The bulk of the African captives came from just six regions in Africa. This was only about 4.4%-5.4% of all who were shipped to the Americas. The majority, about 35% were sent to Brazil and the remainder to other South American and Caribbean colonies.
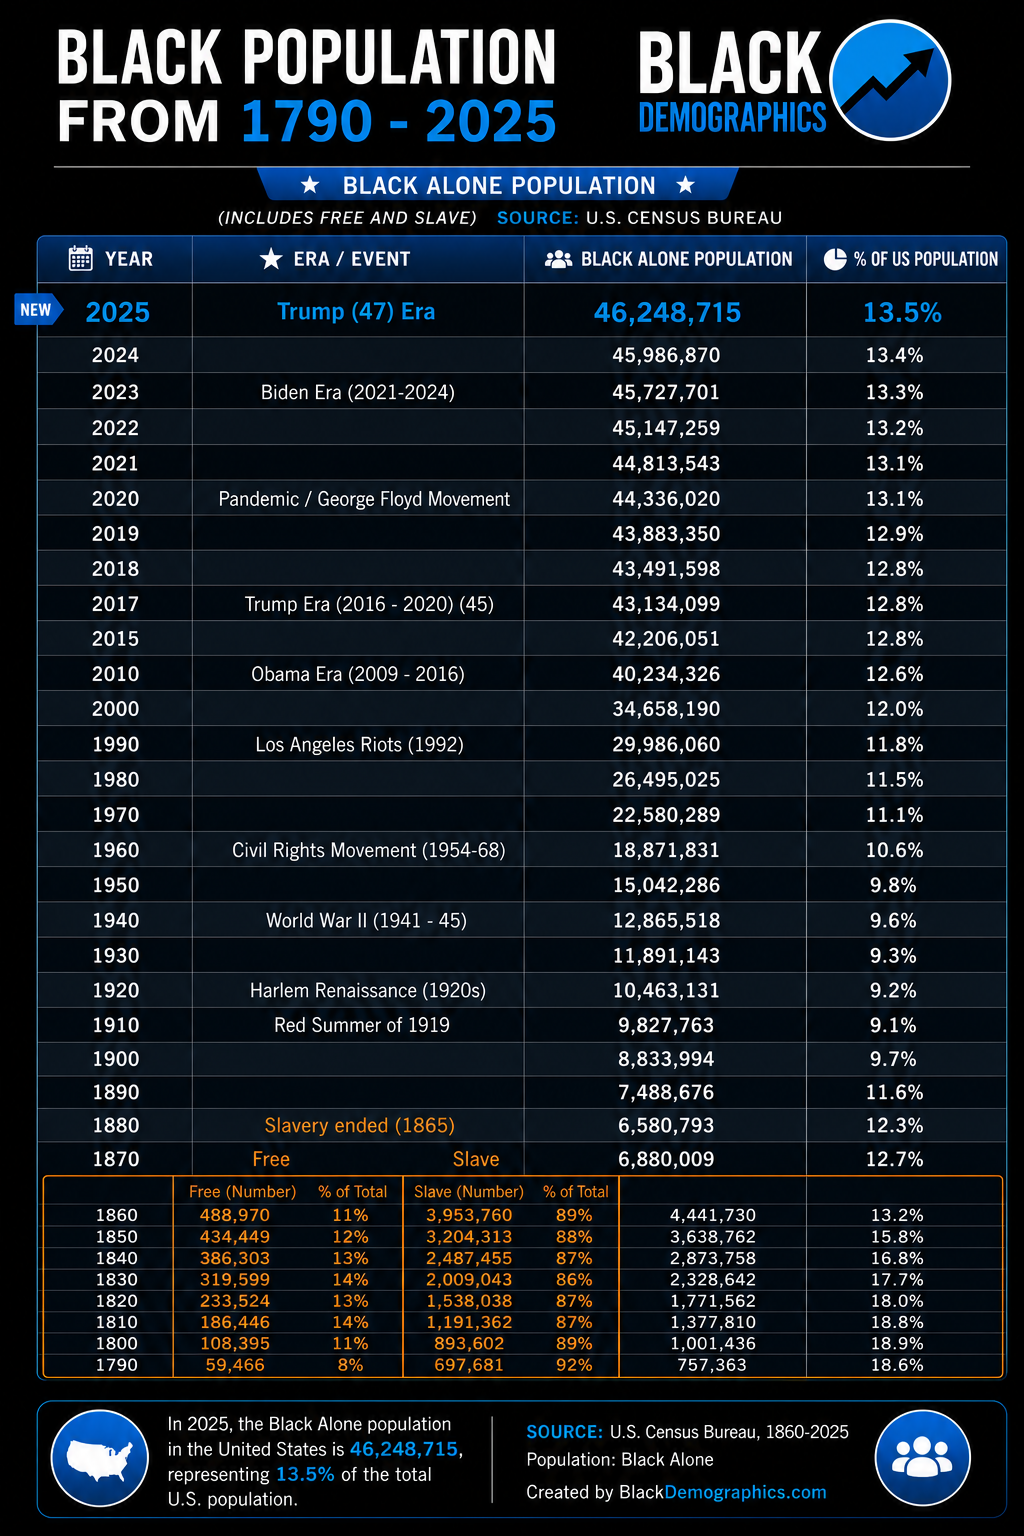
The largest ports of entry for American slaves were Charleston, Baltimore, other ports on the Virginia and Maryland coast and New Orleans. According to the first United States census count 92% of the 757,208 African Americans were slaves. The last census count during slavery in 1860 counted 4,441,830 African Americans of which 89% were slaves. By the turn of the century (1900) the Black population grew to more than 8 million and more than doubled every 50 year period since reaching 42 million by 2010.
Source: The Trans-Atlantic Slave Trade Database http://slavevoyages.org, Wikipedia http://en.wikipedia.org/wiki/Atlantic_slave_trade, BBC http://news.bbc.co.uk/2/hi/africa/6445941.stm